Why OMOP?
Last updated on 2025-09-10 | Edit this page
Overview
Questions
- Why use OMOP?
- Why not use spreadsheets?
- What are the advantages of OMOP?
- What are the disadvantages of OMOP?
Objectives
- Examine the diagram of the OMOP tables and the data specification
- Familiarise with the vocab schema
- Join two or more tables together
- Attempt to join data from spreadsheets with different structures
- Describe the pros and cons on using OMOP vs raw data, why this is the way forward
- Use Athena and other OHDSI tools for reference
- Describe the full landscape of OMOP tools and the community
Introduction
This is a lesson created via The Carpentries Workbench. It is written in Pandoc-flavored Markdown for static files and R Markdown for dynamic files that can render code into output. Please refer to the Introduction to The Carpentries Workbench for full documentation.
What you need to know is that there are three sections required for a valid Carpentries lesson template:
-
questionsare displayed at the beginning of the episode to prime the learner for the content. -
objectivesare the learning objectives for an episode displayed with the questions. -
keypointsare displayed at the end of the episode to reinforce the objectives.
Challenge 1: Compare data from two separate OMOP data sets
Let’s read in an OMOP extract called extract_1 from the local files.
R
omop_dataset_file_location_1 <- here::here("extracts/uclh1")

extract_1 <- read_omop_dataset(omop_dataset_file_location_1)
A colleague at the hospital is familiar with the events that occurred in hospital to one of the patients in the dataset. This patient has been identified by the data team as the anonymised patient with person id 7.
R
extract_1$person |>
  filter(person_id==7) |>
  select(person_id, race_concept_id, gender_concept_id, year_of_birth) |>
  omopcept::omop_join_name_all() |>
  collect()
Verify that the patient details match your colleague’s description.
Let’s take a sample of patients in this dataset, selecting those same columns.
R
extract_1_pt_sample <- extract_1$person |>
  slice_sample(n = 10) |>
  select(person_id, race_concept_id, gender_concept_id, year_of_birth) |>
  collect()
We’ve received another OMOP dataset from another site.
R
omop_dataset_file_location_2 <- here::here("extracts/other_site_1")

extract_2 <- read_omop_dataset(omop_dataset_file_location_2)
Let’s take a sample of patients from the second extract and bind them together.
Note that, because the structure of the data (table names, columns and data types) are set as standard by the OMOP specification, we are guaranteed to be able to bind these two datasets together without error. We can also re-apply the same code, only changing the reference to the new extract.
R
extract_2_pt_sample <- extract_2$person |>
  slice_sample(n = 10) |>
  select(person_id, race_concept_id, gender_concept_id, year_of_birth) |>
  collect()

 bind_rows(extract_1_pt_sample, extract_2_pt_sample)
R
dplyr::tibble(person_id = c(101,102,201,202), year_of_birth = c(1992,1993,1994,1995))
Challenge 2: how do you nest solutions within challenge blocks?
You can add a line with at least three colons and a
solution tag.
Figures
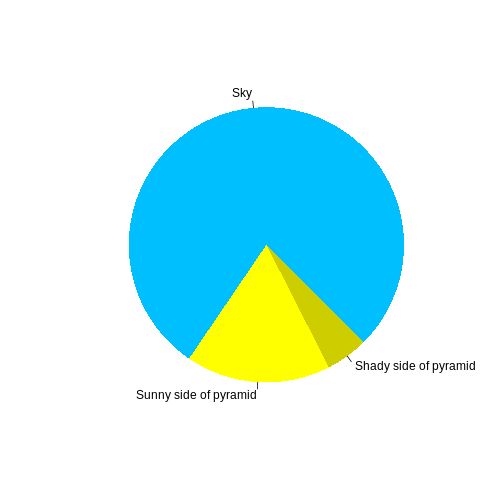
You can also include figures generated from R Markdown:
R
pie(
  c(Sky = 78, "Sunny side of pyramid" = 17, "Shady side of pyramid" = 5),
  init.angle = 315,
  col = c("deepskyblue", "yellow", "yellow3"),
  border = FALSE
)

Or you can use standard markdown for static figures with the following syntax:
{alt='alt text for accessibility purposes'}
Callout sections can highlight information.
They are sometimes used to emphasise particularly important points but are also used in some lessons to present “asides”: content that is not central to the narrative of the lesson, e.g. by providing the answer to a commonly-asked question.
Math
One of our episodes contains \(\LaTeX\) equations when describing how to create dynamic reports with {knitr}, so we now use mathjax to describe this:
$\alpha = \dfrac{1}{(1 - \beta)^2}$ becomes: \(\alpha = \dfrac{1}{(1 - \beta)^2}\)
Cool, right?
- Use
.mdfiles for episodes when you want static content - Use
.Rmdfiles for episodes when you need to generate output - Run
sandpaper::check_lesson()to identify any issues with your lesson - Run
sandpaper::build_lesson()to preview your lesson locally
