What is OMOP?
Last updated on 2025-09-10 | Edit this page
Estimated time: 0 minutes
Overview
Questions
- What is OMOP?
- What information would you expect to find in the person table?
- What information would you expect to find in the condition_occurrence table?
- How can you join these tables to aggregate information?
Objectives
- Examine the diagram of the OMOP tables and the data specification
- Interrogate the data in the tables
- Join these tables to find the concept names
Setting up R
Getting started
Since we want to import the files called *.csv into our
R environment, we need to be able to tell our computer where the file
is. To do this, we will create a “Project” with RStudio that contains
the data we want to work with. The “Projects” interface in RStudio not
only creates a working directory for you, but also remembers its
location (allowing you to quickly navigate to it). The interface also
(optionally) preserves custom settings and open files to make it easier
to resume work after a break.
Introduction
OMOP is a format for recording Electronic Healthcare Records. It allows you to follow a patient journey through a hospital by linking every aspect to a standard vocabulary thus enabling easy sharing of data between hospitals, trusts and even countries.
OMOP CDM Diagram
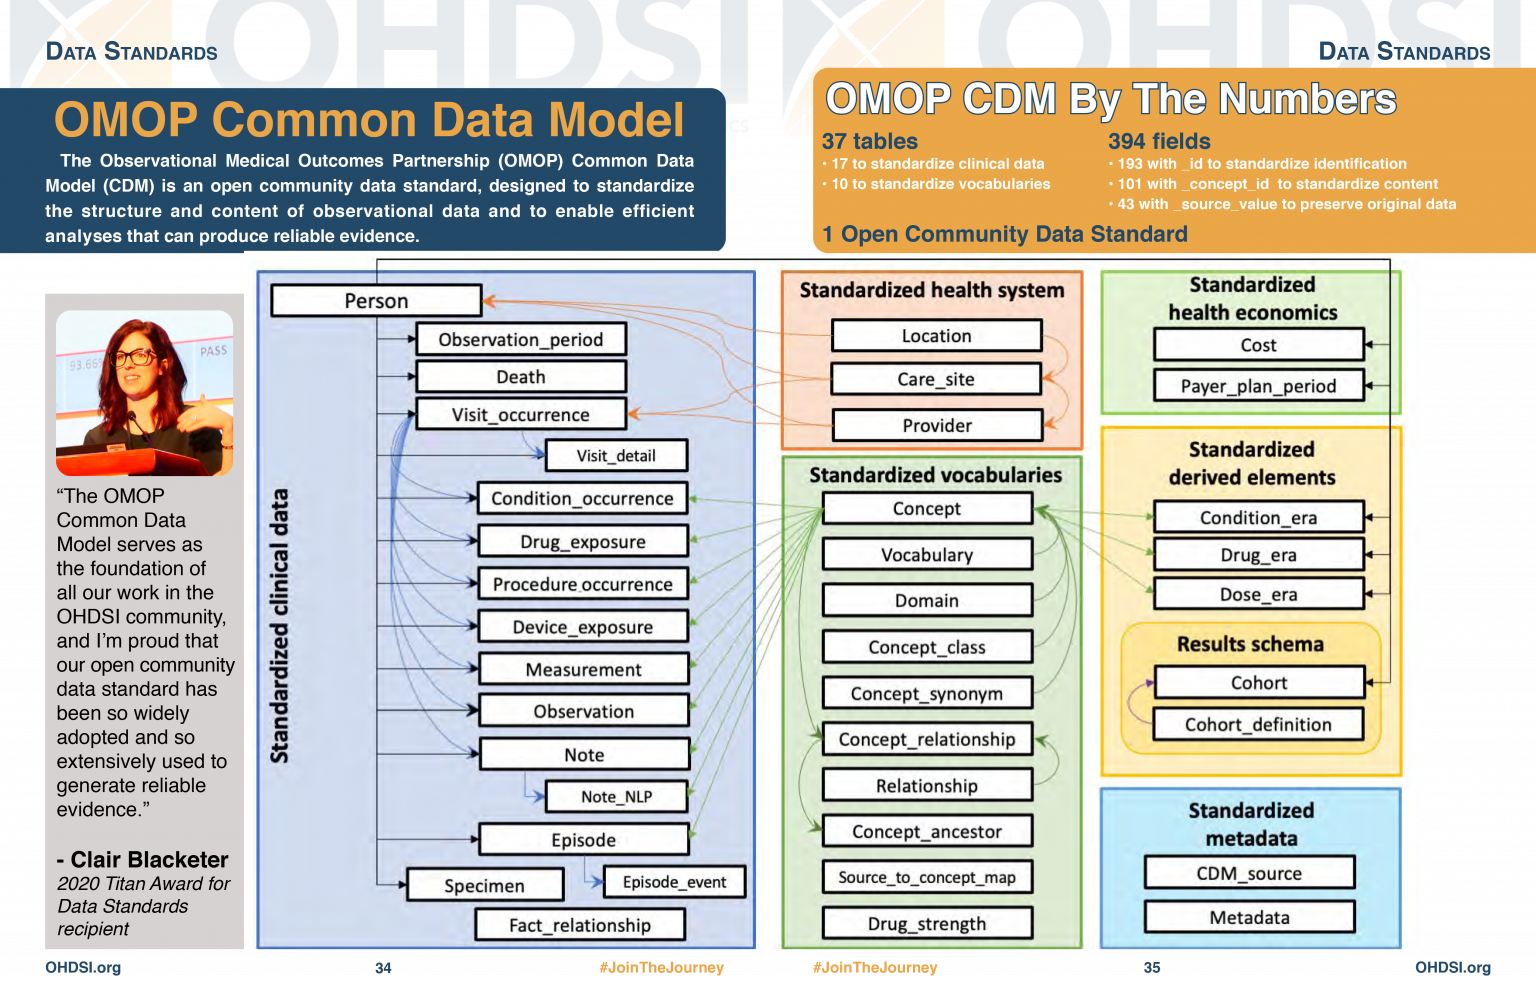
OMOP CDM stands for the Observational Medical Outcomes Partnership Common Data Model. You don’t really need to remember what OMOP stands for. Remembering that CDM stands for Common Data Model can help you remember that it is a data standard that can be applied to different data sources to create data in a Common (same) format. The table diagram will look confusing to start with but you can use data in the OMOP CDM without needing to understand (or populate) all 37 tables.
Test yourself
Look at the OMOP-CDM figure and answer the following questions:
- Which table is the key to all the other tables?
- Which table allows you to distinguish between different stays in hospital?
The Person table
The Visit_occurrence table
There are a handful of core tables and columns that contain key information about a patient’s journey in the hospital. These are 7 tables to get you started :
- person uniquely identifies each person or patient, and some demographic information. This is the central table that all other tables relate to.
- condition_occurrence records relating to a Person suggesting the presence of a medical condition.
- drug_exposure records about exposure of a patient to a drug.
- procedure_occurrence activities carried out by a healthcare provider on the patient with a diagnostic or therapeutic purpose.
- measurement numerical or categorical values obtained through standardized examination of a Person or Person’s sample.
- observation clinical facts about a Person obtained in the context of examination, questioning or a procedure.
- visit_occurrence records of times where Persons engage with the healthcare system.
Why use OMOP?
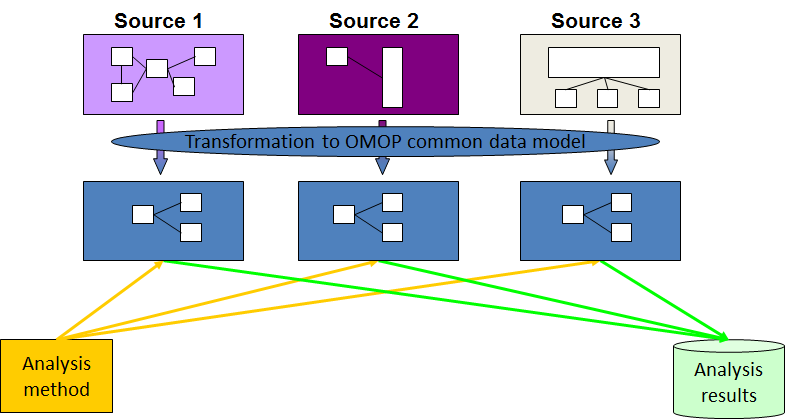
Once a database has been converted to the OMOP CDM, evidence can be generated using standardized analytics tools. This means that different tools can also be shared and reused. So using OMOP can help make your research FAIR.
Check that everyone knows what FAIR stands for
Some simple tables
Loading Data
Now that we are set up with an Rstudio project, we are sure that the
data and scripts we are using are all in our working directory. The data
files should be located in the directory data, inside the
working directory. Now we can load the data into R, there are three data
files person.csv, condition_occurrence.csv and
drug_exposure.csv. Read each of these into a table with the
same name.
I have used read.csv because using the more up to date
package caused issues with types, which I would have gone into if it
hadn’t then caused issues with joining and I ran out of time
Read the Data
There are three data files person.csv,
condition_occurrence.csv and
drug_exposure.csv. Read each of these into a table with the
same name.
NOTE: The data does have headers.
R
person <- read.csv(file = "data/person.csv")
condition_occurrence <- read.csv(file = "data/condition_occurrence.csv")
drug_exposure <- read.csv(file = "data/drug_exposure.csv")
When you have read in the data, take some time to explore it.
Adding concept names
You will have noticed that content of the tables are not terribly easy to understand. This is because everything in OMOP is viewed as a concept that allows it to be related to one or more standard vocabularies such as SNOMED, ICD-10, etc.
We have developed a package that makes it very easy to add concept names to the tables.
You will need the function omopcept::omop_join_name_all(). This will look up the concept_id in the main table of concepts and add a column for the name of the concept associated with that id.
Who’s who?
By creating tables that also have the name of the concepts answer the following questions
- How old is the black gentleman?
- In which month was an unspecified fever prevalent in the hospital?
- What was the ethnicity of the patient not affected by this fever?
- Give a description of the patient who received Amoxicillin because they were wheezing?
R
library(omopcept)
person_named <- person |> omop_join_name_all()
OUTPUT
Warning: downloading a subset of omop vocab files, pre-processed.
If you want to make sure you have the vocabs you need, download from Athena, save locally & call `omop_vocabs_preprocess()`
OUTPUT
downloading concept file, may take a few minutes, this only needs to be repeated if the package is re-installedR
condition_occurrence_named <- condition_occurrence |> omop_join_name_all()
drug_exposure_named <- drug_exposure |> omop_join_name_all()
- 25 (or 24 if he hasn’t had his birthday this year)
- July
- Don’t know - it hasn’t been specified
- A 53/54 white female
Joining and interrogating the tables
Using join
We established when looking at the diagram that the person table was the key to accessing all the other tables. In fact it is the person_id column that is the actual key that will allow us to join with other tables.
So we can join two of the tables together to get information about the different conditions suffered by each person.
I am going to use a left join because I want a record of every person and the conditions they may have.
R
library(dplyr)
person_condition <-
  person_named |>
  left_join(condition_occurrence_named, by = join_by(person_id) )
This produces a new table with all the column names from both tables and six rows.
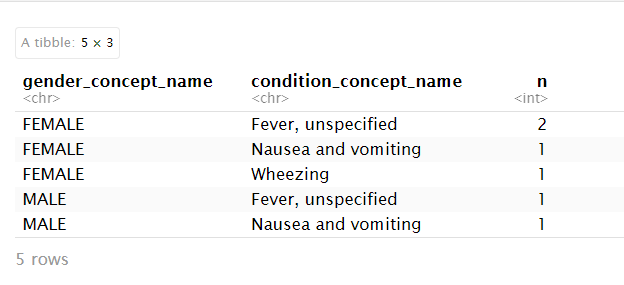
Using count
Challenge
Count the number of people with each condition
R
person_condition |> count(gender_concept_name, condition_concept_name)
OUTPUT
# A tibble: 5 × 3
  gender_concept_name condition_concept_name     n
  <chr>               <chr>                  <int>
1 FEMALE              Fever, unspecified         2
2 FEMALE              Nausea and vomiting        1
3 FEMALE              Wheezing                   1
4 MALE                Fever, unspecified         1
5 MALE                Nausea and vomiting        1
This produces a table:
For the Confident
Using the “GiBleed” database work out the number of male and female patients with each condition_concept_id
R
cdm$person |>
  left_join( cdm$condition_occurrence, by = join_by(person_id) ) |>
  group_by(condition_concept_id, gender_concept_id) |>
  summarise(num_persons = n_distinct(person_id)) |>
  collect() |>
  ungroup() |>
  omopcept::omop_join_name_all() |>
  #remove some columns to make display clearer
  select(-condition_concept_id, -gender_concept_id) |>
  arrange(condition_concept_name)
OUTPUT
# A tibble: 158 × 3
   condition_concept_name    gender_concept_name num_persons
   <chr>                     <chr>                     <dbl>
 1 Acute allergic reaction   MALE                         57
 2 Acute allergic reaction   FEMALE                       59
 3 Acute bacterial sinusitis FEMALE                      418
 4 Acute bacterial sinusitis MALE                        368
 5 Acute bronchitis          FEMALE                     1300
 6 Acute bronchitis          MALE                       1243
 7 Acute cholecystitis       FEMALE                       29
 8 Acute cholecystitis       MALE                          6
 9 Acute viral pharyngitis   MALE                       1284
10 Acute viral pharyngitis   FEMALE                     1322
# ℹ 148 more rows
Solutions for working out Who’s who programmatically.
How old is the black gentleman?
R
library(dplyr)

year_of_birth <- person_named %>%
  filter(grepl("black", race_concept_name, ignore.case = TRUE)) %>%
  select(year_of_birth)

person_age <- year_of_birth$year_of_birth[1]
age = 2025 - person_age

print(age)
OUTPUT
[1] 25In which month was an unspecified fever prevalent in the hospital?
The lubridate package has a function
R
library(lubridate)
OUTPUT
Attaching package: 'lubridate'OUTPUT
The following objects are masked from 'package:base':

    date, intersect, setdiff, union
R
 month = month(ymd("2025-01-30"), label = TRUE)
 print(month)
OUTPUT
[1] Jan
12 Levels: Jan < Feb < Mar < Apr < May < Jun < Jul < Aug < Sep < ... < Dec
which returns month = Jan
The dyplr package has a function that will allow you to add columns to a table
R
 new_person_table = mutate(person, age = 2025-year_of_birth)
 print(new_person_table)
OUTPUT
  person_id year_of_birth gender_concept_id race_concept_id age
1         1          1980              8532        46285833  45
2         2          1971              8532        46286810  54
3         3          2000              8507        46285836  25
4         4          2010              8507        37394011  15
which adds a column called age to the person table
R
library(dplyr)
library(lubridate)

fever_months <- condition_occurrence_named %>%
  # Filter for rows where the condition name contains "fever"
  filter(grepl("fever", condition_concept_name, ignore.case = TRUE)) %>%
  # Extract month from the condition_start_date
  mutate(month = month(condition_start_date, label = TRUE)) %>%
  # Select just the month column for the results
  select(month) %>%
  # Count occurrences by month
  group_by(month) %>%
  summarise(count = n()) %>%
  # Sort by count (descending)
  arrange(desc(count))

# This gives us a table with the months where people had a fever and how many people had the fever each month. The question tells us that there is only one month so we select that.
fever <- fever_months$month[1]

# View the results
print(fever)
OUTPUT
[1] Jul
12 Levels: Jan < Feb < Mar < Apr < May < Jun < Jul < Aug < Sep < ... < DecWhat was the ethnicity of the patient not affected by this fever?
R
library(dplyr)

people_without_condition <- person_named %>%
  # we want to join with the people who do not meet the condition
  anti_join(condition_occurrence_named %>%
    filter(grepl("fever", condition_concept_name, ignore.case = TRUE)),
    by = "person_id")

  ethnicity <- people_without_condition$race_concept_name

# View results
print(ethnicity)
OUTPUT
[1] "Ethnicity not stated"Give a description of the patient who received Amoxicillin because they were wheezing?
R
library(dplyr)

# Query to find persons prescribed amoxicillin for wheezing
amoxicillin_for_wheezing <- person_named %>%
  # Join with condition_occurrence table
  inner_join(condition_occurrence_named, by = "person_id") %>%
  # Filter for wheezing condition
  filter(grepl("wheez", condition_concept_name, ignore.case = TRUE)) %>%
  # Join with drug_exposure table to find medications
  inner_join(drug_exposure_named, by = "person_id") %>%
  # Filter for amoxicillin prescriptions
  filter(grepl("amoxicillin", drug_concept_name, ignore.case = TRUE))

  # again the question implies there is only one person
  age <- 2025-amoxicillin_for_wheezing$year_of_birth[1]
  gender <- amoxicillin_for_wheezing$gender_concept_name[1]
  ethnicity <- amoxicillin_for_wheezing$race_concept_name[1]

# View results
print(age)
OUTPUT
[1] 54R
print(gender)
OUTPUT
[1] "FEMALE"R
print(ethnicity)
OUTPUT
[1] "White: English or Welsh or Scottish or Northern Irish or British - England and Wales ethnic category 2011 census"- Using a standard makes it much easier to share data
- OMOP uses concepts to link dated to standard vocabularies
- R can be used to join and interrogate data