What is OMOP?
Figure 1
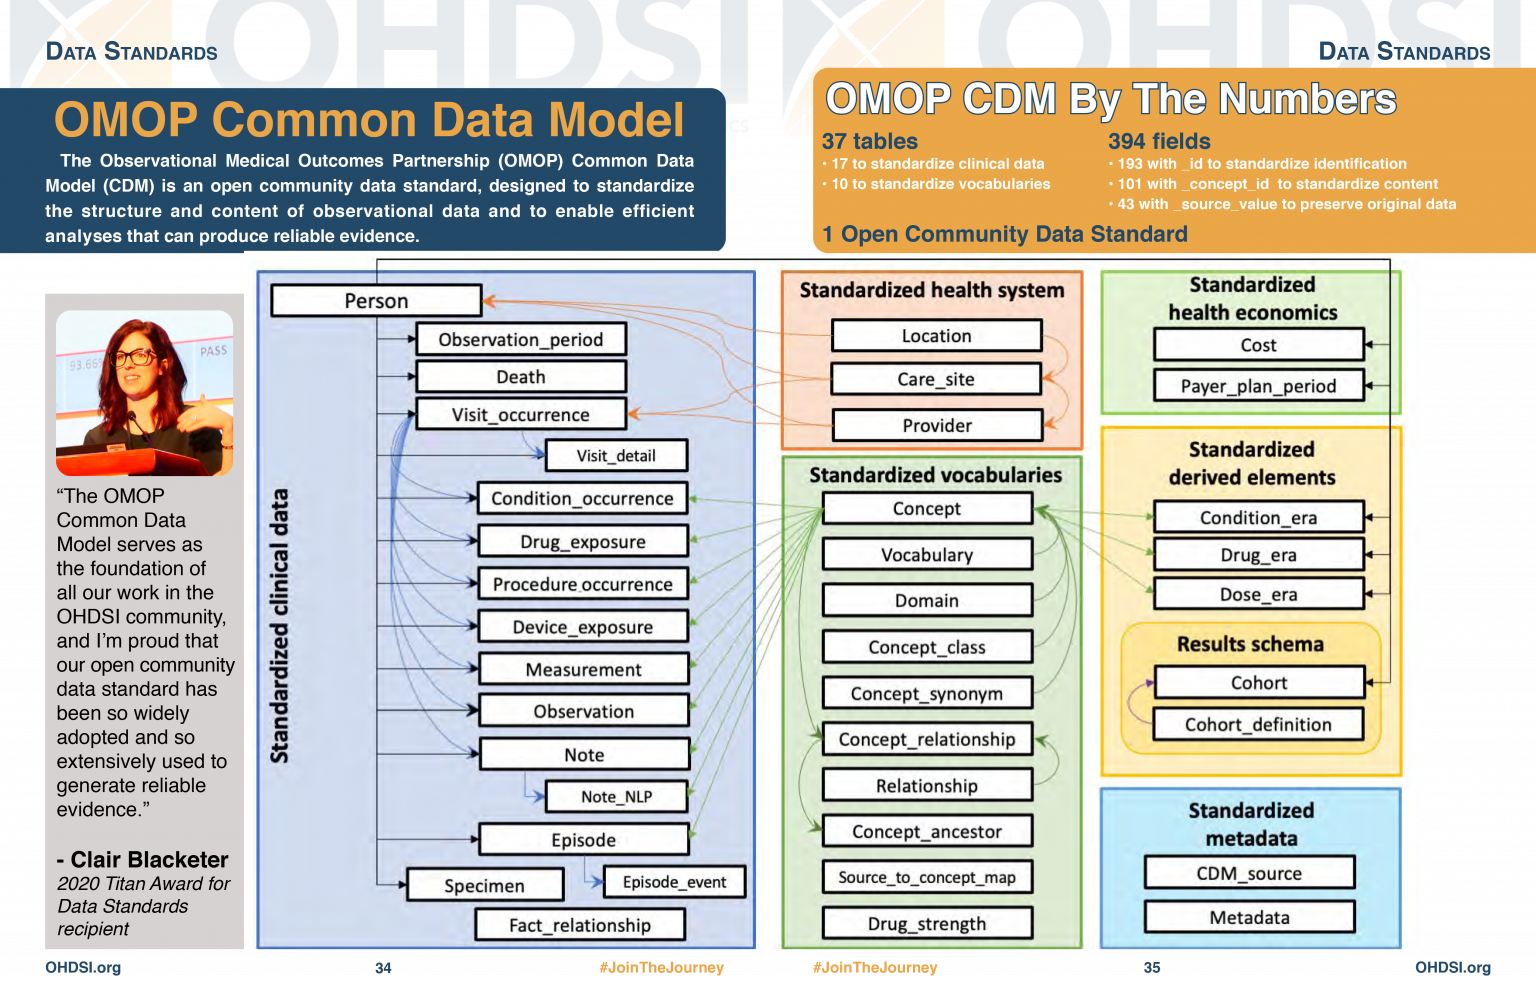
The OMOP Common Data Model
Figure 2
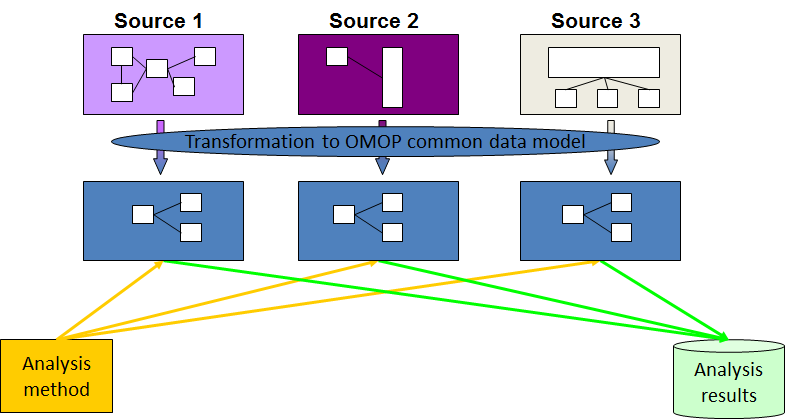
Rationale for the use of OMOP-CDM
Exploring OMOP concepts with R
Parquet files
More on concepts
Measurements and Observations
Conditions and Visits
Medications
Figure 1
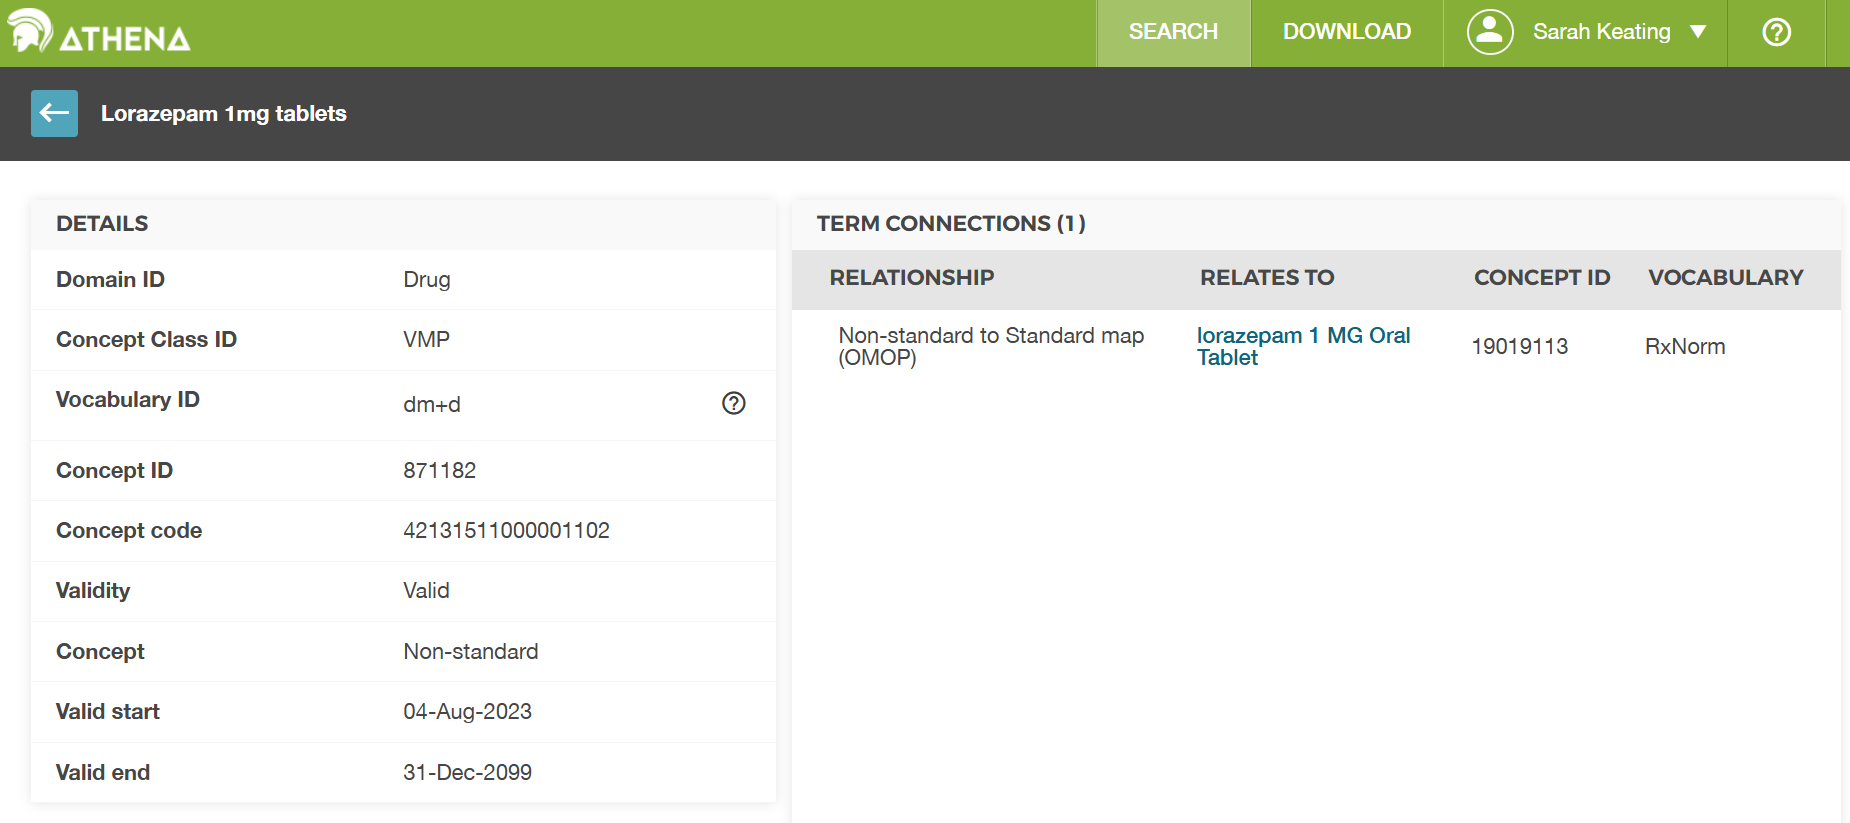
The OMOP Code 871182
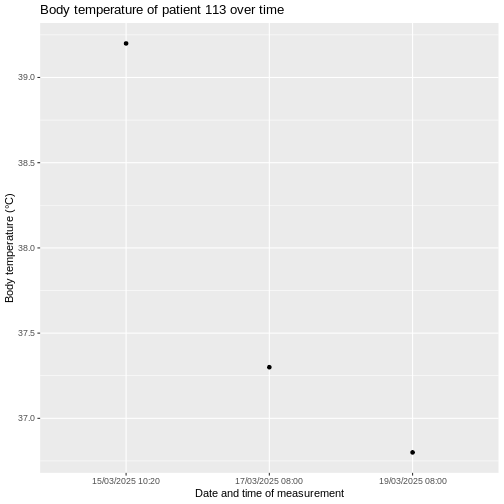
Dates and timesDates and times in OMOP
Figure 1